
Samy Mansour
Partner •
Sydney

The latest quarterly report on foreign investment in Australia from the Treasury was released in June 2024 for the period 1 October 2023 to 31 December 2023 (Q2 2023/24), closing out the 2023 calendar year.
Looking across the FIRB data for the 2023 calendar year:
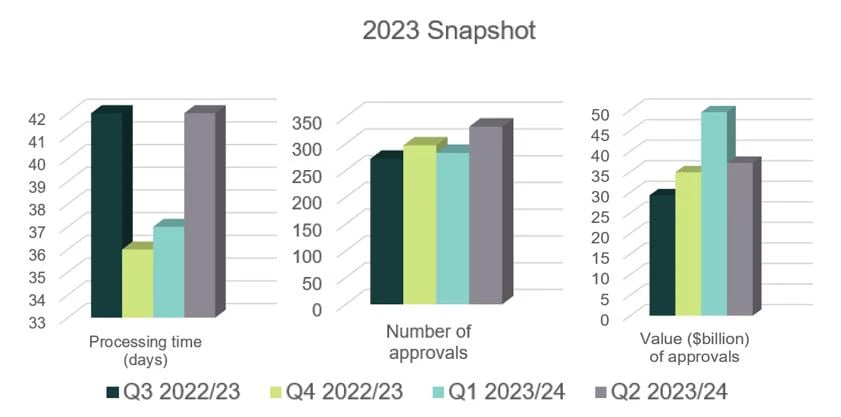
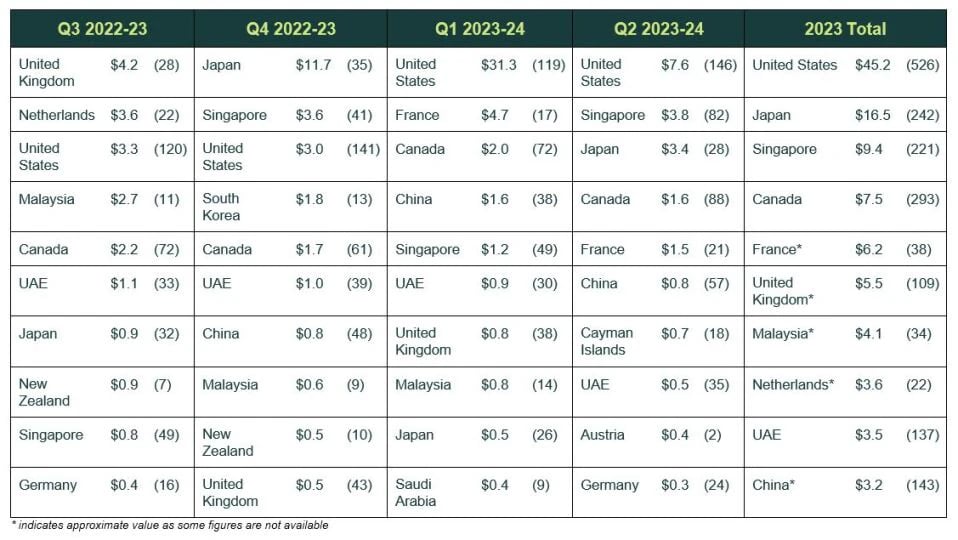
Although a significant drop from Q1 2023/24 figures, the United States remained the top source of commercial investments into Australia for Q2 ($7.6 billion, down from $31.3 billion in Q1), followed by Singapore ($3.8 billion), Japan ($3.4 billion), Canada ($1.6 billion) and France ($1.5 billion), rounding out the top five. Entering into the top 10 investor countries by value was the Cayman Islands ($0.7 billion), Austria ($0.4 billion) and Germany ($0.3 billion). As shown in the 2023 Snapshot above, the total value of commercial investment proposals in Q2 2023/24 dropped to $37.2 billion ($49.5 billion in Q1 2023/2024), closer reflecting Q4 2022/23 numbers.
In relation to investments into residential real property, for Q2 2023/24, as with previous quarters, China ($0.8 billion) was the top source. The other countries investing in Australian residential real property in Q2 2023/24 were Hong Kong, India, Vietnam Taiwan, Nepal, Singapore and Indonesia, all at $0.1 billion.
The table below identifies the top 10 countries investing into Australia over the 2023 calendar year:
Value $billion (number)
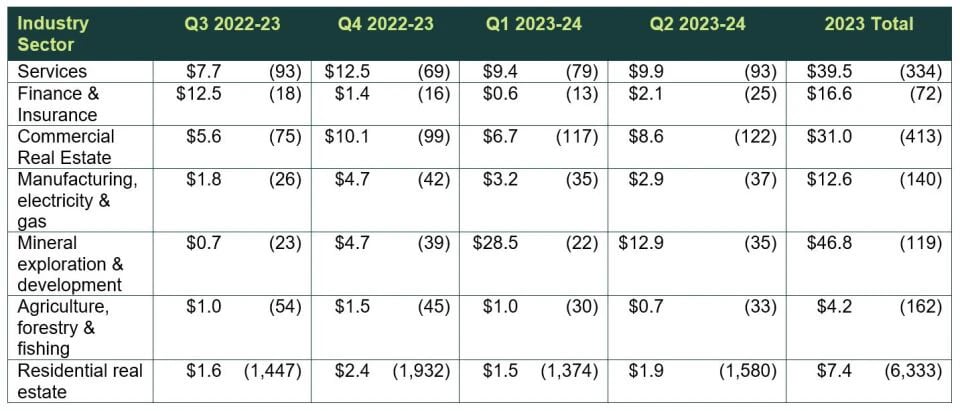
Continuing the trend of direct investment in the preceding quarter, mineral exploration & development ($12.9 billion) remained the industry sector attracting the largest amount in Q2. However, the margin to the next industry sector was substantially less compared to the Q1 2023/24 period ($28.5 billion). This marks a change from the Q3 and Q4 2022/23 period, where the mineral exploration & development sector ranked 7th and 4th, respectively amongst the 7 industries, signifying the volatility in foreign investment across the short term. For Q2, services was second ($9.9 billion), commercial real estate was third ($8.6 billion) and manufacturing, electricity & gas ($2.9 billion) fourth. Both the services and commercial real estate sectors experienced a slight uptick in investment (by value) as compared with Q1 2023/24 ($9.4 billion and $6.7 billion, respectively).
As identified in the table below, over the 2023 calendar year, the services industry sector took a backseat to the mineral exploration & development sector as the sector attracting the largest portion of investment funds in Australia. The top five industry sectors over that period otherwise remained steady being services, commercial real estate, finance & insurance and manufacturing, electricity & gas.
The table below identifies the investment into the seven industry sectors over the 2023 calendar year. Notably, for the last 2 consecutive quarters, the mineral exploration & development sector has enjoyed the largest share of investment funds in Australia, overtaking the services industry which led in Q4 2022/23:
Value $billion (number)
Of the 332 approved commercial investment proposals for Q2, 145 were approved with conditions and 187 were approved without conditions. By monetary value, approximately 70.4% of these investment approvals had conditions imposed on them for the quarter ($26.2 billion out of $37.2 billion). This represents an approximate 10% decrease as compared with the preceding quarters in the 2023 calendar year.
48 commercial investment proposals were withdrawn in Q2 (representing around 12.63% of applications), as compared to 98 in Q1 2023/24. This is a return to Q4 and FY 2022-23 trends (13.8% and 11.3%, respectively). No prohibition order was issued in respect of commercial investment applications in Q2.
For Q2, of the 332 approved commercial foreign investment proposals, 16 applications related to national security actions (11 mandatory and 5 voluntary). This is a marginal increase in the number of national security applications as compared to Q1 2023/24 (13 out of a total of 283). However, it reflects a decrease from the previous Q3 and Q4 2022/23 periods (28 out of a total of 272 and 24 out of a total of 297, respectively).
In Q2, 42 days was the median processing time for approved commercial investment proposals, marking a return to the results of the Q1 2022/23 period and a slight increase from the median processing time of 37 days in Q1 2023/24 and 36 days in Q4 2022/23. 75% percent of approvals were considered in less than 60 days, including 35% in 30 or less days. This mirrors the Q1 2023/24 period (noting a slight decrease in the percentage of approvals determined in 30 days or less, which is down from 40% in Q1 2023/24).
While processing times remain above the statutory timeframe for the majority of approvals, with the advent of new foreign investment policy reforms, we would expect processing times to soon fall, at least for some repeat investors, and those investing in non-sensitive businesses. It remains to be seen whether processing times will be shorter than current median times for all investors, including those without an investment history into Australia and those investing in a sensitive business (such as critical infrastructure, critical minerals or critical technology).
If you would like to know more about how your foreign investment application could be affected by these trends, please contact us.